We are committed to providing exceptional facilities management across all UQ sites and campuses, in line with the University's teaching and research goals and strategic objectives.
UQ Space Planning and Management is part of the UQ Property and Facilities Division. Our main objective is to deliver physical planning and management of the University sites and spaces, including:
2. Space reporting
We provide a broad range of reports on space utilisation and growth trend analysis to UQ organisational units. The reports can be used to support strategic management of space utilisation, through summaries of space data for particular locations, buildings, floors, or an entire portfolio, including:
- recorded historical space data for space utilisation trend analysis
- real-time space utilisation and occupancy
- detailed space utilisation forecast.
All reports are user configurable, allowing standard reports to be adapted to departments/sections/faculties/schools and other organisations’ unique requirements, with the ability to include graphs, floor plans, and dynamic data demonstration. Users also have the ability to define pre-set values for dashboard reports, with values displayed in all customised designed graphs.
Space utilisation is accounted through several reports and platforms including:
Space utilisation reports
The Space Management team conducts regular space audits, in order to verify the utilisation of rooms, such as classrooms and offices.
To conduct these audits, we assess:
- Wi-Fi, using data from internet connectivity
- Si-pass, using data stored from room access with swipe cards
- camera counting, through Cohera using infrared system and Axis using images
- casual or planned space audits, which are undertaken by trained space auditors, coordinated by the Space Planner.
The results of the audits are used to calculate frequency of occupancy, which form the basis for the proposition of options to optimise the utilisation of those spaces. For instance, before suggesting reallocating a room from one organisational unit to another, the Space Management team verifies its utilisation using one of the aforementioned tools.
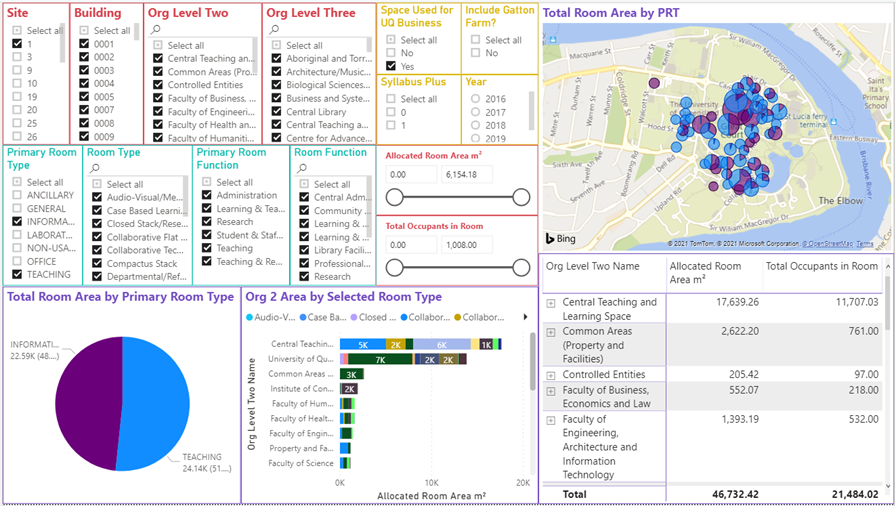
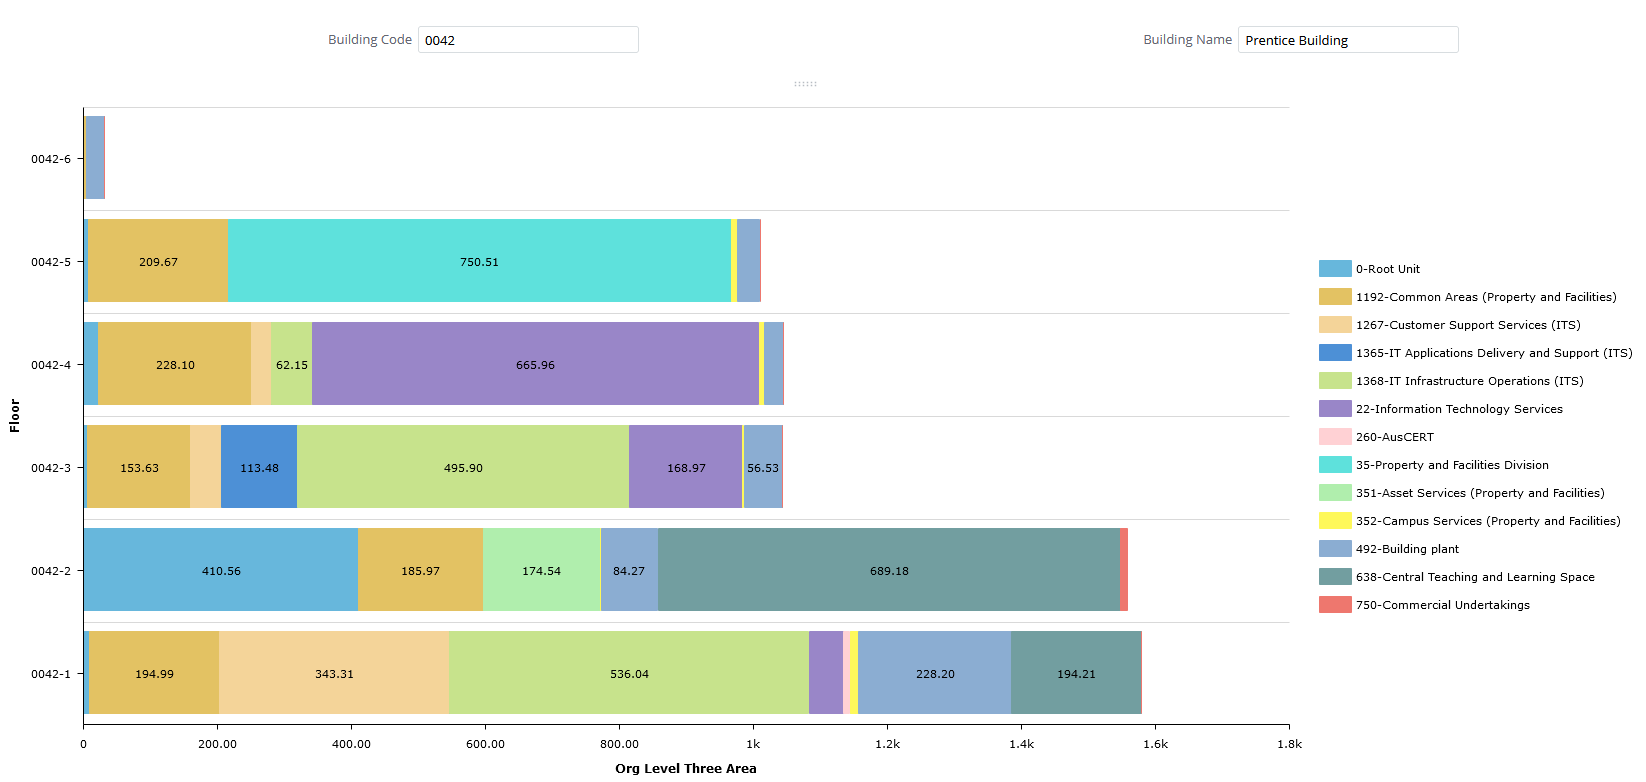
Power BI reports
Power BI reports uses a bulk of data from different years by applying different filters to generate charts and table that can visually demonstrate the information requested.
Questions related to space matters are often asked in a very specific way. Power BI makes it very easy to create customised visuals instead of plain excel graphs.
ARCHIBUS reports
ARCHIBUS can generate an array of reports from Space Management Module, Where’s my Desk Module, and Where’s my Team Module.
![]()
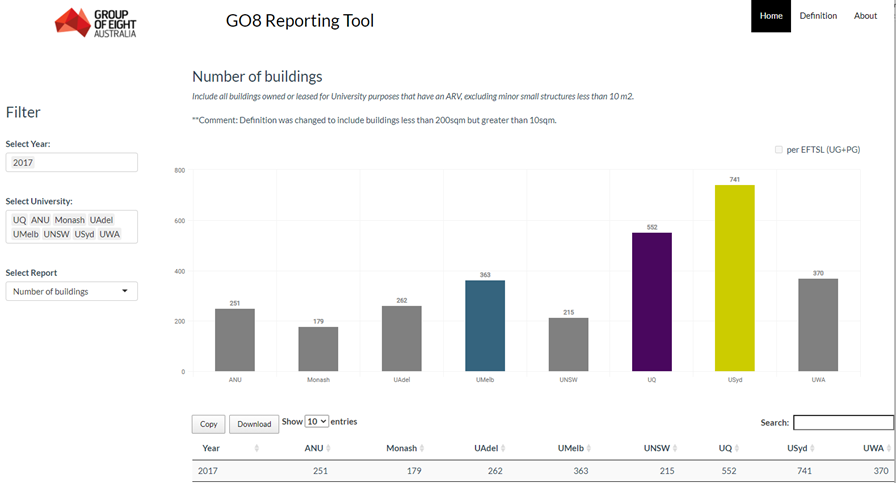
TEFMA and Go8 reporting
The Space Management team also provides reports on UQ space portfolio for TEFMA and Group of Eight Australia (GO8), such as:
- GO8 Reporting Chart
- UFA / Internal EFTSL Chart
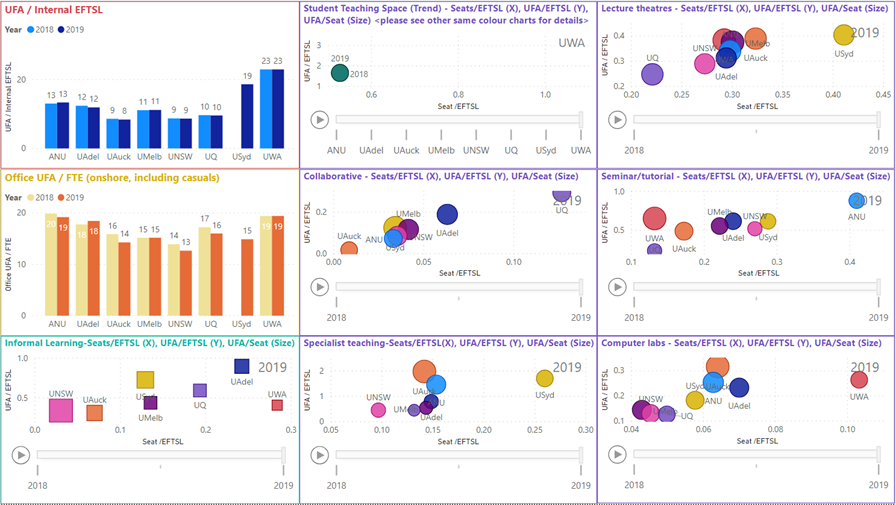
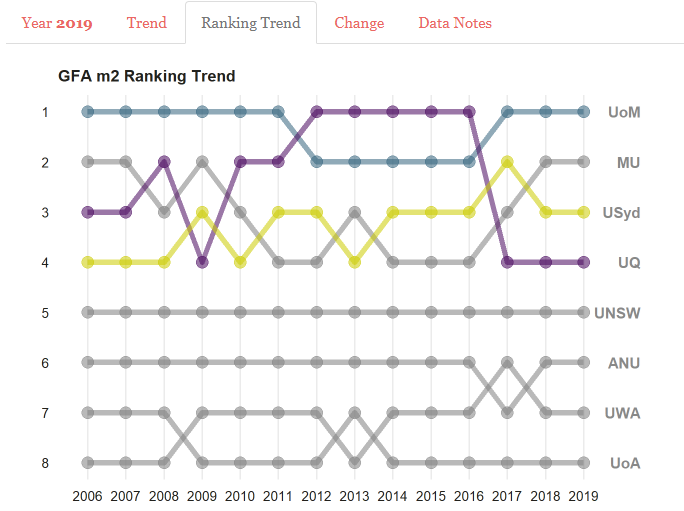
- GFA m2 Ranking Trend chart
Questions and feedback:
Space Management team
Property and Facilities
We can assist you with:
ARCHIBUS Accessing UQ space informationOffice relocations Requesting a space on campusAttending UQ space events and tours